A Primer on Attaining High-Impact Flow
 https://pixabay.com/en/businessman-production-planning-3105871/
APICS Magazine – 2018
By Peter J. Sherman and Michael A. M. Bork
Creating optimum flow is one of the core principles of lean philosophy. Effective flow enables companies to deliver products and services in a shorter period of time, have significantly less work in process (WIP), and be more flexible and adaptable with changes in customer specifications. There are two types of flow: pull and push.
The APICS Dictionary defines pull systems as “the production of items only as demanded for use or to replace those taken.” These strategies work effectively in businesses that have short lead times or that make products with short shelf lives. Push is explained as “the production of items at time required by a given schedule planned in advance.” In other words, goods are produced based on demand forecasts of what the company thinks customers will want. Push strategies are appropriate for businesses with long lead times or that are cyclical in nature — for instance, stocking shelves for the holidays.
Following is a practical, three-step approach to analyzing the flow of an operation — in this instance, a fulfillment process — by finding the takt time, identifying bottlenecks and streamlining operations. Importantly, this methodology can be applied without significant investments in capital equipment or adding headcount.
Find takt time and capacity
The first step is answering the question, What is the customer demand? To figure this out, review historical orders over the past 12-18 months to get a sense if demand is steady, increasing, decreasing or volatile. Look for patterns in demand such as seasonality. Ask sales and forecasting departments about their projections for orders on a daily, weekly or monthly basis. Meet with product development professionals to better anticipate new product rollouts and timing.
The heartbeat of this synchronized system is known as takt time. The name comes from the German term for rhythm. As the APICS Dictionary explains, takt time “sets the pace of production to match the rate of customer demand and becomes the heartbeat of any lean production system.” Takt time is calculated as:

For example, assume demand is 10,000 orders per month or 500 orders per day. The hours of operation are 8 a.m. to 5 p.m. with two 15-minute breaks and 30 minutes for lunch, making available production time 8 hours or 480 minutes.
This result means that one order should be completed every 0.96 minutes in order to meet customer demand. Notice that takt time ignores the amount of labor or machines.
Next, analyze the operation. Begin by determining capacity — in other words, the number of units that can be filled each day. Knowing the capacity of an operation helps determine the extent to which demand can be met. First, find the process time of each step. The APICS Dictionary tells us that process time is “the time during which the material is being changed, whether through a machining operation or an assembly.” (See Figure 1.)

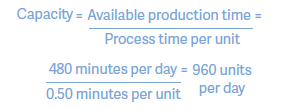
Now, it’s possible to calculate the capacity, or maximum number of items that can be processed by a resource in each time period. A resource can be labor or equipment. For this exercise, assume one worker per step and that ava
ilable production time is 8 hours per day. The capacity for step 1 (pick) is as follows:
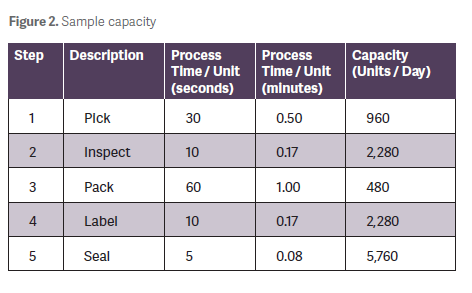
Next, take the result and calculate capacity. (See Figure 2)
Identify bottlenecks
Once capacity for each step in the process has been calculated, determine the capacity for the overall operation. To do this, first identify the bottlenecks. A bottleneck is any limiting resource or the slowest step in a process. According to the APICS Dictionary, a bottleneck can be a “facility, function, department or resource whose capacity is less than the demand placed upon it. For example, a bottleneck machine or work center exists where jobs are processed at a slower rate than they are demanded.” Figure 2 shows that step 3 (pack) has the lowest capacity (480 units per day) and is, thus, the bottleneck.
Another way to analyze processes is by identifying the capacity utilization, which is a measure of how much of the capacity of an operation is being used. This highlights where there may be excess slack in the system. Capacity utilization is expressed as a ratio of the amount of resources being used divided by the amount of resources available in that time period. (See Figure 3.) The capacity utilization for step 1 (pick) is:

In other words, the pick step isbeing used 50 percent of the time, assuming 480 units (the maximum) are produced each day. This means that the pick resource could potentially be idle the other 50 percent of the time.
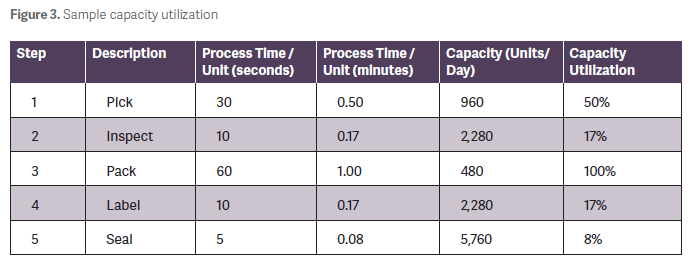
Of course, in reality, businesses rarely allow resources to remain idle. Instead, workers or machines continue producing at each step. The result is excess WIP — defined by the APICS Dictionary as “a good or goods in various stages of completion throughout the plant, including all material from raw material that has been released for initial processing up to completely processed material awaiting final inspection and acceptance as finished goods inventory.” Excess WIP in a fulfillment center, a factory floor or even a service operation can lead to many unintended consequences including lost items, missing paperwork, less usable space and damage.
Streamline operations
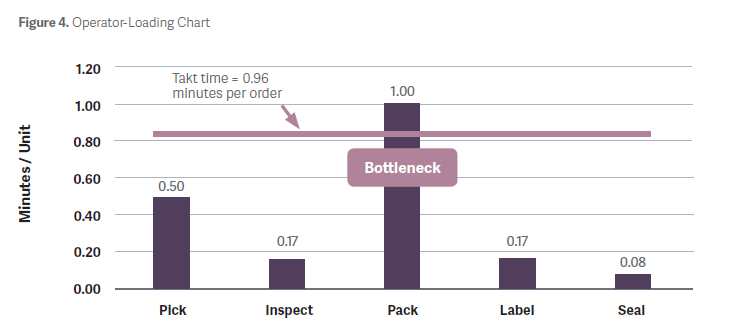
Now that this key operational data has been determined, it’s time to improve and streamline the process. An operator-loading chart is one of the most effective ways to visually see process times at each step relative to the takt time. (See Figure 4.) Again, packing is the bottleneck that exceeds takt time. Consequently, the current process configuration cannot meet the customer demand of 500 orders per day.
Fortunately, there are several options to cost-effectively increase process capacity.
Distribute the work to underutilized workers.
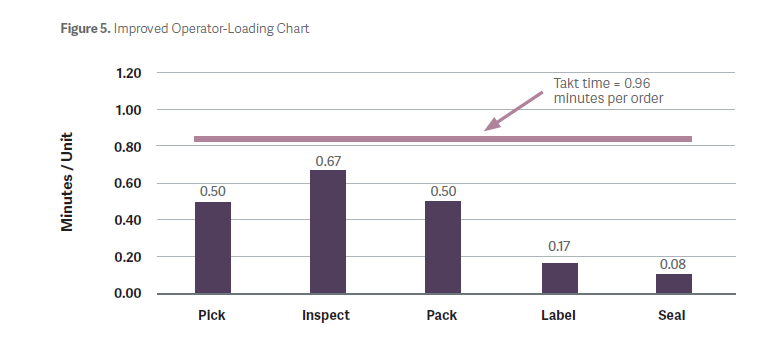
The operator-loading chart indicates that the pick, inspect, label and seal stations have a significant amount of buffer in terms of process time relative to the takt time. One option to consider would be sharing half of the pack work with inspect workers. This would mean adding 30 seconds of process time to the inspect workers while removing 30 second of process time from the pack workers. Figure 5 shows the new, balanced operator-loading chart. Note that none of the steps exceed the takt time. Equally important, daily capacity has increased significantly. Distributing work may not always be possible where there are physical constraints or limited tools and equipment. It does require cross-training and may necessitate adding tools and machines.
Consolidate work functions.
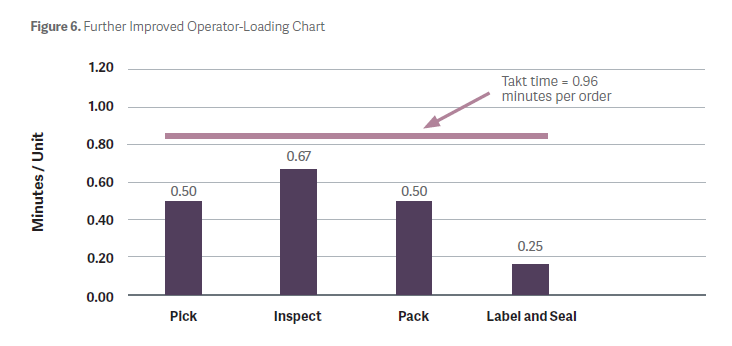
The original operator-loading chart illustrates that the label and seal steps are sequential, are inherently similar in scope and have sufficient buffer time to consider consolidating. This consolidation also would free up one worker for other activities. Figure 6 shows the operator-loading chart with these improvements implemented.
Reduce the batch size.
Until now, it has been assumed that orders in the fulfillment example are processed or batched one at a time at each step, a practice called one-piece flow. There are many benefits of one-piece flow including minimizing process time, keeping WIP at its lowest level and increasing flexibility to respond to customer changes. The downside is that there may be additional costs associated with more frequent setups for changeovers.
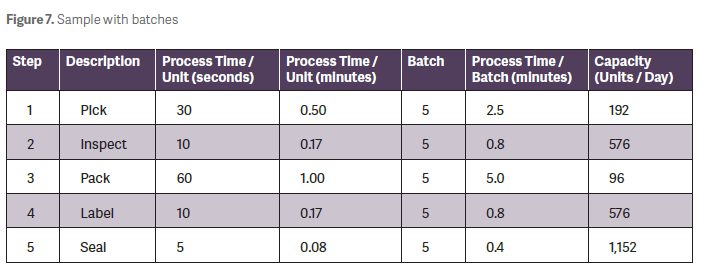
On the other hand, consider what would happen if the fulfillment operation completed orders in batches of five. In other words, work would only be released to the next step after five orders were completed from the previous step. Figure 7 shows the impact of this configuration. The main benefit would be achieving economies of scale through bulk discounts from material suppliers and fewer changeovers. However, batching does have its limitations: Process time increases, which reduces capacity, and WIP builds up.
Increase available operating time.
This can be achieved by reducing defects and, therefore, reducing the time associated with rework. Some tactics to increase operating time include
- setting up fulfillment work stations before business hours so the frontline can hit the ground running
- shortening changeover processes
- eliminating nonvalue-added activities, such as excess motion, by placing supplies and tools closer to work stations
- decreasing idle minutes due to equipment downtime with more frequent preventive maintenance
- maintaining adequate inventory levels to prevent work stoppages
- conducting routine maintenance, upgrades and inventory cycle counts during off-hours
- Scheduling lunches at the end of a shift or staggering breaks to minimize delays and create a more continuous workflow.
Finally, don’t overlook the power of creating a safe work environment as a method for increasing operating time. It’s not only the right thing to do for employees, but it also prevents downtime from work-related injuries.
Keeping the flow
Effective flow is key to meeting customer demand while optimizing resources. Share this approach with frontline workers, explain concepts such as takt time and bottlenecks, and demonstrate how to use and interpret key tools. These initiatives will help satisfy customers, engage employees in key processes and ensure the business is profitable.

Comments :