
Improving Outcomes at a Rehab Hospital: Lean Six Sigma Principles Help Georgia Facility Reach Discharge Goals
Improving Outcomes at a Rehab Hospital: Lean Six Sigma Principles Help Georgia Facility Reach Discharge Goals
ISE Magazine February 2021 Volume: 53 Number: 2
By Cassandra Stallworth, Gina Tipton and Casey Bedgood
https://www.iise.org/iemagazine/2021-02/html/bedgood/bedgood.html
Rehabilitation Hospital Navicent Health (RHNH), located in Macon, Georgia, has been serving patients since September 1988. The facility is the oldest and most experienced medical rehabilitation provider in central Georgia and one of only three specialty free-standing hospitals in the state. The 58-bed facility is accredited by DNV GL (Det Norske Veritas and Germanischer Lloyd) and ISO 9001:2015 certified (www.navicenthealth.org/service-center/rehabilitation-hospital-navicent-health).
In 2013, Navicent Health began the continuous improvement journey with internal lean Six Sigma training via the Institute of Industrial and Systems Engineers. The organization imbedded two Six Sigma black belt leaders, with other full-time responsibilities, in the facility with the intent of creating a culture of continuous improvement and transforming the care journey for many patients, families and communities.
Recently, a multidisciplinary team was assembled to improve patient discharge outcomes in the spirit of continuous improvement. Typically, rehab patients come to this facility from those with higher care levels to prepare them for a transition back to the community with the goal of assuming normal lives as much as possible. The team began targeting the number of patients discharged each month from RHNH to skilled nursing facilities, community locations and acute care facilities.
In short, the ideal goal is to discharge more patients from the rehab hospital to a community location and fewer to skilled nursing facilities and acute care facilities. The overarching focus was to improve health, healing and hope for all patients, families and communities. Moreover, the operational aim is to meet national benchmark goals for each category.
Define
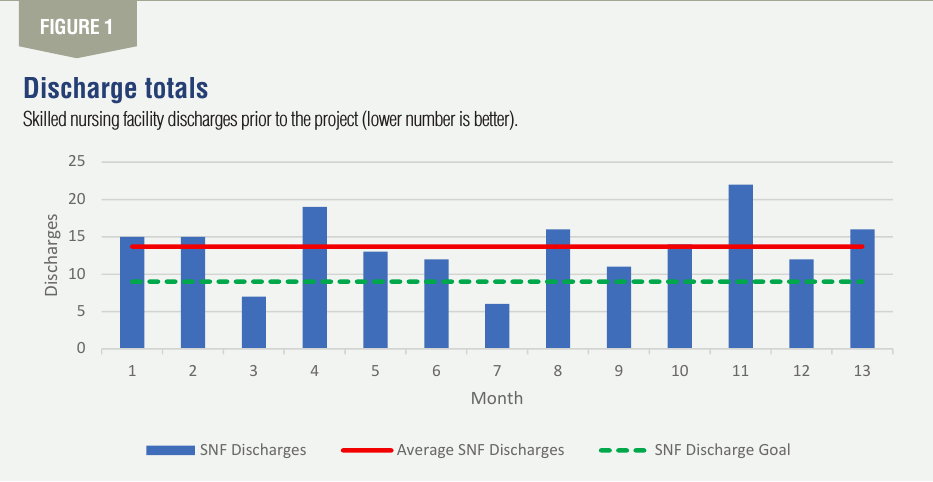
The team began the continuous improvement journey by defining the problem. At a deeper glance, it was evident that skilled nursing facility discharges were much higher than the national benchmark (i.e., goal). The monthly performance was 14 discharges per month for the prior year with a goal of nine discharges or fewer per month. With these discharges, less is better. See Figure 1 for details pre-project.
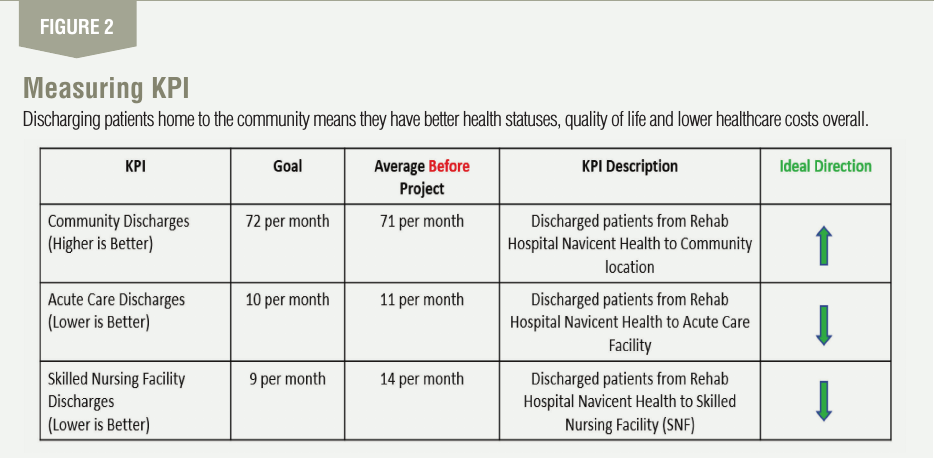
The team also discovered that discharges to community lo-cations and acute care facilities also were not meeting the goal. For the same time period, community discharges averaged 71 per month compared to a goal of 72 per month. For these dis-charges, more is better. In terms of discharges to acute care facilities, RHNH was sending 11 per month to these facilities with a goal of 10 per month on average. For these patients, less is better.
You may ask why this matters. It is important because dis-charging patients home to the community means they have better health statuses, quality of life and lower healthcare costs overall. Also, if patients have lower health levels leaving rehab facilities, they will spend more time in advanced care settings that are more expensive, less convenient and absorb al-ready scarce resources that others may need. Thus, costs will be higher and the quality of life for patients, families and other stakeholders will be less than optimal.
Meeting national benchmark goals for all three discharge categories leads to higher revenue levels, decreases costs and enhances the human aspect. If key performance indicators continued to trend unfavorably to the goal, the organization will experience lost revenue, unsustainable cost increases and challenges to the community perception’s and hospital’s reputation.
To improve the current state, the team set a goal to meet the national benchmark for each discharge category – community, skilled nursing facility and acute care – within six months of the project initiation. From a dollar improvement standpoint, the goal was to improve by at least $100,000 in the same time period through cost reduction and revenue growth. These goals were vitally important as rehab facilities typically experience higher costs and lower reimbursement, even in ideal operating environments. So, the team had to make improvement a reality.
As the goal-setting process transpired, the team also considered possible constraints. The most significant limitations related to historical processes and organizational culture. Culture is how work is done in an organization. As the saying goes, “Old habits die hard” (organization and environmentally dependent). The overarching discovery was that old processes and the current state of doing business needed to change in order to realize improvement and make it stick.
Measure
Once the define phase was complete, the team focused on measuring the current state. The KPI of focus included dis-charge rates to community locations, skilled nursing facilities and acute care facilities. They were measured monthly and focused on the actual number of discharges for each category favorable to goal.
In addition, dollar savings of improvements for all three KPIs was measured as previously noted. When measuring each KPI, the focus was to display trends over time using a simple run chart. There were three focal points: goals, performance to goals and trends (i.e., favorable or unfavorable to goal). See Figure 2 for details.
Analyze
After defining the problem and measuring historical performance, the team analyzed the issues using a variety of tools.
Analysis tools included run charts, control charts, histograms, detailed process maps, fishbone diagram and swim lane diagram. The run charts revealed that each KPI category was not meeting the national benchmark as noted in the define phase. Further analysis revealed that control charts for skilled nursing facilities and communities were in control, stable and predictable. For discharges to acute settings, the control chart was out of control, not stable or predictable.
Individual moving range control charts were used for this analysis. The fishbone diagram helped the team pinpoint three micro issue sources: people, process and resourcing. These issues centered around patient/family expectations for rehab care they were receiving, lack of financial means and housing accommodations and patient family goals for their care experience. Irrespectively, the team realized these barriers had to be overcome in order to improve the situation long-term.
Improve/implement
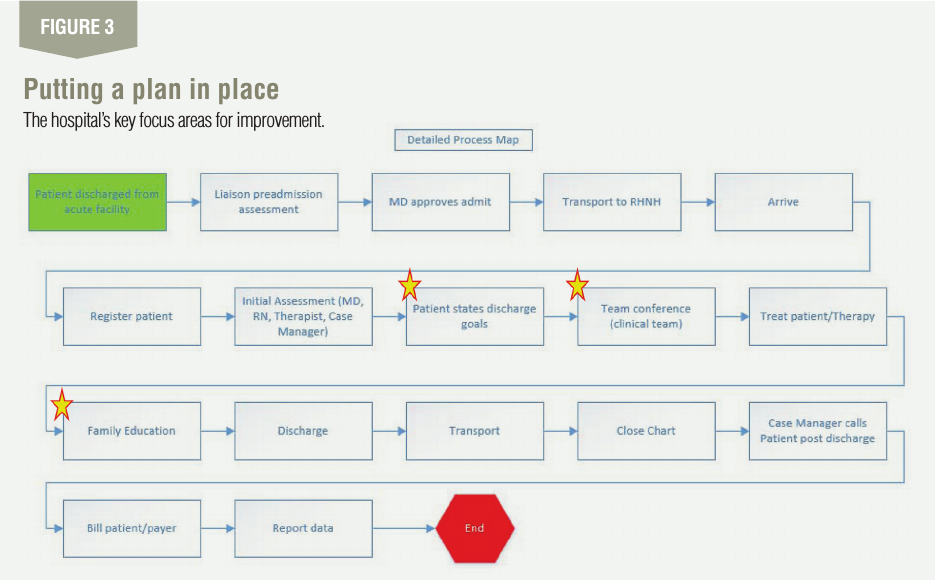
To improve the situation long term, the team focused on four areas: improved forms with management accountability; new management for case managers to handle transitions between care sites; family plus patient education; and shifting patient/family goals. See Figure 3 for focus areas in the process map.
The team implemented three improvements. First, it shifted patient/family goal setting to start on patient arrival to Rehab Hospital Navicent Health. This gave patients and their families realistic targets, expectations and resourcing to achieve desired outcomes. The tollgates for each goal were measured, tracked and monitored for ideal progression during the patient’s stay.
Second, the team focused heavily on improving initial and ongoing education to patients and their families. Education is key to allowing all stakeholders to “see the forest for the trees” and plan for what “will” come next, along with what “could” come next. This helped eliminate ambiguity, uncertainty and provided clarity as to the care provided at each goal step.
Finally, the improvement team enhanced patient treatment plans to include feedback from patients and families by care teams, based on their outcome goals. The takeaway was to include the voice of the customer early on. What did patients and families want? What did they really need? What realistically could be accomplished at the rehab hospital? Each of these questions was answered before any goals were set and really transferred ownership of the outcomes, care trajectory and end results to the customers.
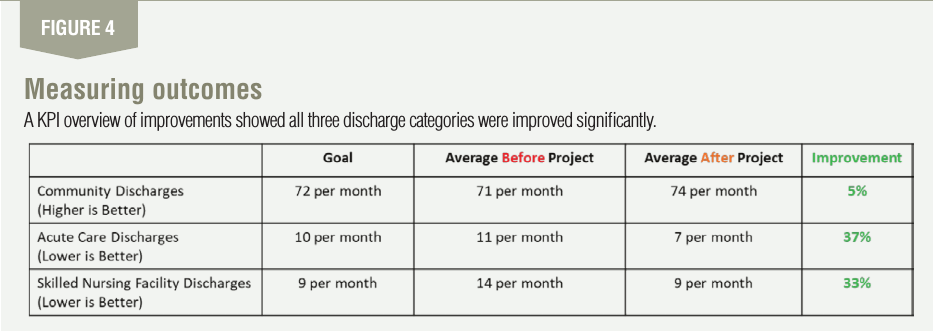
Once these improvements were implemented, the team began to remeasure each KPI and noticed immediate improvements. In short, all three discharge KPI categories were improved significantly. Discharges from the rehab hospital to skilled nursing facilities were improved by 33%. Also, com-munity discharges were improved by 5% while acute care discharges were improved by 37%. See Figure 4 for details.
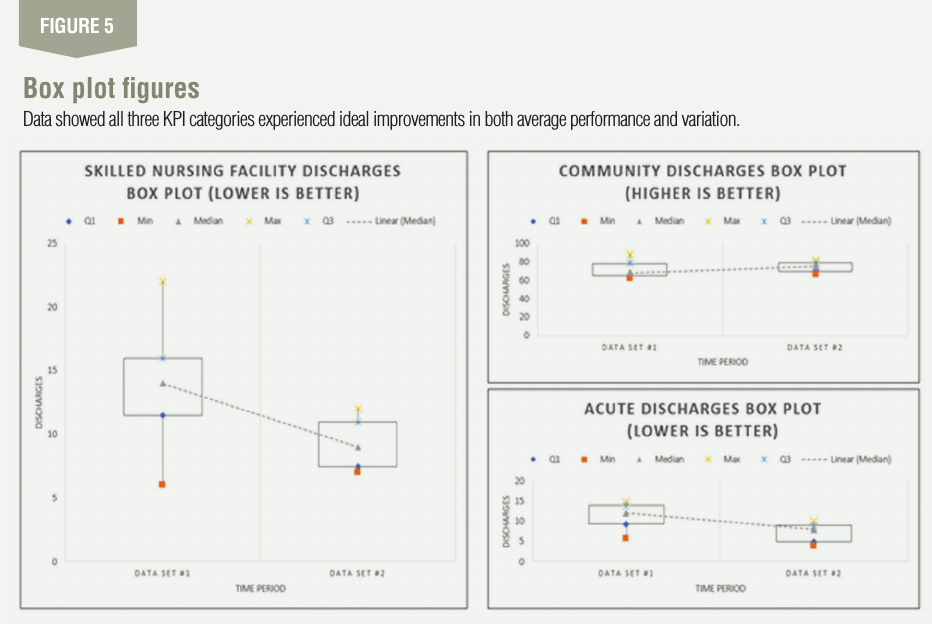
The team also used box plots to compare performance be-fore and after improvements. As noted in Figure 5, all three KPI categories experienced ideal improvements in both aver-age performance and variation (i.e., range). As noted earlier, the goal was to decrease skilled nursing facility discharges and acute care discharges while increasing community discharges. Figure 5 illustrates improvement for each KPI category was achieved.
To further test the project results, test of hypothesis (paired comparison small sample size) was used. The theory stated that skilled nursing facility discharges would decrease with improvements and aggressive process redesign. The null hypothesis states there is no change, while the alternative hypothesis states there is a change. One tail test was used. The results showed T test (2.236) was greater than 1 Tail T table (2.132). Thus, the process improvements decreased skilled nursing facility discharges at the 95% confidence level. Moreover, a correlation analysis was used to compare com-munity discharges to skilled nursing facility discharges, post improvement. The correlation coefficient “r” was used as the determining factor. When comparing many months of data post improvements for both variables, the analysis showed a strong correlation as “r equaled -.7”. Thus, as skilled nursing facility discharges decreased, community discharges increased. There was an indirect correlation between the two variables.
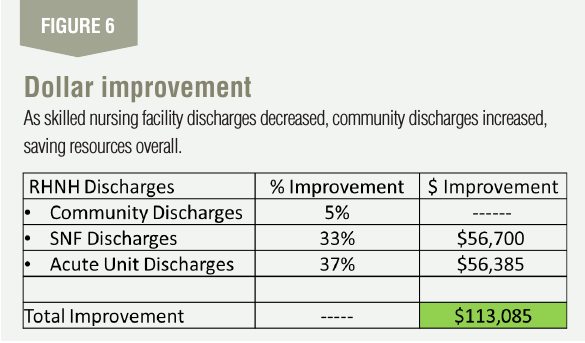
From a dollar improvement standpoint, the efforts saved $113,085 during the project time frame from February-June 2020 with savings trends expected to continue (See Figure 6).
Control
The control plan consists of monitoring, reporting and continued measurement of the KPIs previously noted: discharged patients from RHNH to community locations, acute care facilities and skilled nursing facilities, with an emphasis on this subgroup. The realized dollar impact is ap-proximately $6,500 average per improved discharge. Daily monitoring occurs via data, reports and leadership oversight in various dashboards, report-out sessions and leadership meetings. This information is cascaded up to the board and quality management system.
Customer requirements are and should be the centerpiece of all administrative planning. The main takeaways from this project are people, process and structure. People are the most important aspect of healthcare delivery. The customer not only includes patients, but families and communities served. The team learned early on that identifying the customers along with their needs, expectations and desires were crucial to improving discharge outcomes.
Process and structure are often understated and cannot be overlooked. Creating a repeat-able process that is hard-wired into organizational culture will accelerate success or lead to failure if not handled properly. It cannot be overstated to keep it simple: Establish a good process, follow it and be willing to change what is not working.
Moreover, part of a sound improvement structure is ensuring mechanisms exist for accurate and accessible data. You don’t know what you don’t know and you will never know what you cannot measure. Simply put, know your numbers, track them frequently and pivot when goals are not being met or trends are unfavorable to the goal.
It is important to note that the team accomplished this great project during the height of the COVID-19 pandemic when time was limited, resources were scarce and focus shifted away from the normal state of doing business. If ever asked, does lean Six Sigma really work? Simply put: Every time if used properly.
Comments :