
How Eliminating Waste Boosted Meter Installation by 100% in New York
How Eliminating Waste Boosted Meter Installation by 100% in New York
ISE Magazine March 2021 Volume: 53 Number: 3
By Gerhard Baumann and Satvinder Sidhu
https://www.iise.org/iemagazine/2021-03/html/baumann/baumann.html
There is no question about the importance of renewing and improving the electrical infrastructure in the United States. Aging structures only provide high probability of accidents that most of the time affect vulnerable areas. One of the key initiatives to overcome aging infrastructure is to modernize the electrical grid with cutting-edge technology devices that not only provide good quality of services but also are in alignment with where information technology is heading in terms of big data analysis capabilities to constantly increase the value proposition to customers.
Advanced metering infrastructure (AMI), or simply smart metering, is defined as “an integrated system of smart meters, communication networks, and data management systems that enables two-way communication between utilities and customers” (mordorintelligence.com). The growth in smart meters deployment, supported by government policies and funded incentives, has been constant for the past decade in the United States, as shown in Figure 1.

To cope with this rate of installation, projects must be delivered more efficiently to meet contractual requirements and stakeholders’ expectations. In undertaking such large efforts, all of us know that managing teams becomes complex – challenges around planning and logistics coordination are present, project risks materialize and issues with visibility for actual performance may arise.
Our client was in a situation in which the deployment of an AMI project was delayed, the rate of installation was not optimal and below planned. In other words, the forecast at the early stage of the project was not prominent.
To understand the root cause of those problems and revert the project performance, Motive Power Inc. applied Lean and Six Sigma principles and developed tools.
Background on the project
Motive Power was contracted by a large East Coast utility company to assist in the project execution by developing and finding processes and tools to install smart meters efficiently in the greater New York City area.

The project covered the geographic area of the Manhattan, Bronx and Westchester boroughs (Figure 2). Between the three boroughs, there were approximately 2.5 million smart meters to be installed.
In looking at the initial limited performance data available, the consultants in charge of the project identified a few red flags that raised attention. Naturally, the first step to have a thorough understanding of the project was to gather and understand the historical performance data.
After the consultants analyzed the findings, the conclusions suggested that the utilities company suffered at several fronts: a lack of a robust planning process that made it difficult or impossible to develop logistics plans; the external stakeholders’ management for building access was not in place; the presence of large multidwelling units that was not considered; assignment of teams and individual assignments was ad hoc; there was no baseline for weekly targets, which were increasing monthly; and determining which meters re-quired special technicians was invisible.
Lean and Six Sigma concepts were implemented to drive the desired improvements. The goals of this consulting project that took place during July 2018 through February 2019 were enhancing profitability and reducing costs through improved quality, productivity and efficiency. The business driver for pursuing this project came down to cost and time.
Detailed project description
This project used the DMAIC methodology (define, measure, analyze, improve, control) iteratively to diagnose and improve the contractor’s meter installation process. Emphasis was placed on the measure and analyze stages to under-stand the frequency of the problems while identifying their root causes.
The process performance was measured early on to assess the overall situation and determine project health. Various sets of data were readily available to both the contractor and Motive Power for usage. The sources included daily reports on installation jobs, which included fields such as installation time, location, technician name, start time, end time, meter type and other relevant information. While all the fields are self-explanatory, meter type was a critical measure that needed to be accounted for since different types of meters required advanced skills. Daily, weekly, and monthly metrics were derived from this data.
Another measurement was conducted by plotting all installation jobs on a geographic information system (GIS) platform. This helped to visually interpret which districts were worked on and how productivity looked. In addition to production data, baseline schedules, forecast metrics and actual metrics were also available. All this data allowed for the development of daily production trackers, which included technician install rate, break time and efficiency; geo-graphical maps; and proper resourcing. Although measurement was done throughout the project, initially it was clear that the contractor was significantly behind schedule and it was vital to determine how to get back on track.
Process mapping and visual mapping tools similar to Google Earth, Google Maps and Excel 3D maps were used to analyze the problem and determine the root causes. Although enough technicians were available and everyone had their daily re-source assignments, efficiency remained low. Everything from the warehouse assignments of meters to technicians going out to the field for installation seemed to be flowing, yet the data proved otherwise.
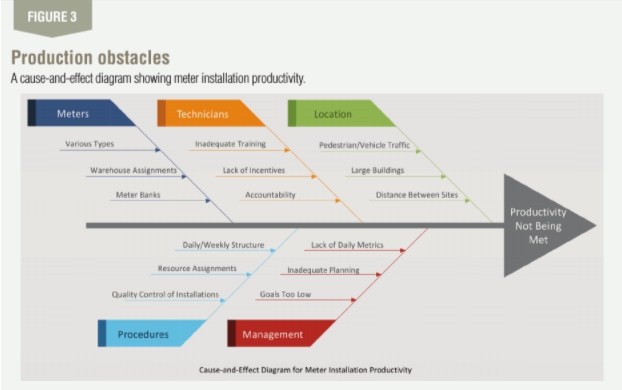
After careful analyses, the primary root causes were identified to be the distance traveled between meter locations; accessibility to buildings; large skyscrapers and the challenges faced within them; wrong technician assignments; wrong meter type assignments; and lack of group assignments. Figure 3 shows the cause-and-effect diagram created for brainstorming these causes and their relevant effects.
These root causes allowed productivity to decline. Building supervisors required advanced notice to ensure technicians had proper access on the day of installation. However, this responsibility was not assigned to one specific individual and often fell through the cracks, causing technicians to wait for hours.
The warehouse planners were also sending technicians to multiple sites throughout the day. While acceptable, planners failed to consider the distance between sites, resulting in long walks with heavy equipment. Outside Manhattan, technicians were driving 30 minutes between locations.
Moreover, skyscrapers brought on an entirely new challenge. Too few technicians were sent out and multiple floors became incomplete because of it. The goal was to complete an entire building on the day of the initial visit. However, the lack of planning prevented this. Lastly, unqualified technicians were assigned to advanced meters, and wrong meters were shipped from the warehouse to the sites, causing delays of their own.
To solve these root causes, solutions in the form of dashboards for process feedback, solution scenario analysis and waste elimination were created, along with various productivity reports to increase efficiency. These tools were used in conjunction with worker narratives and root cause analysis to identify and categorize waste events within the seven types of waste. Waste reductions were primarily in waiting, extra processing, transportation and motion.
To effectively eliminate waste, many process changes and improvements had to be considered and implemented. Daily, weekly and monthly installation plans were created first. The installation plan took into consideration the meter type, location and the number of meters at a specified address. It also helped ensure forecasted targets were being met as they were increasing monthly. After considering these variables, jobs were grouped by each day and sent out to the warehouse and installation teams.
This work plan established four things: 1. meter types were matched with skill level; 2. warehouse shipping became more organized; 3. drive and walk-time between sites was reduced; and (4) large buildings were assigned an adequate number of installers.
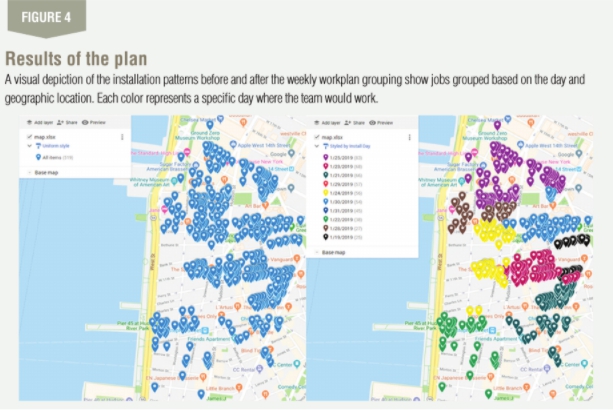
This installation plan also helped visualize where technicians would work on a given day while being able to plan for road closures, festivals or any other disturbances. Figure 4 shows how the weekly installation plan looked visually with jobs grouped based on the day and geographic location. Each color represented a specific day where the team would work. As one can see, keeping the area within a few blocks was essential for productivity. In addition to technicians having this data, a list of addresses was sent to the newly developed “Building Notification Team” responsible for calling each address at least two weeks before the install date to ensure access was granted by the building supervisor.
This installation plan, through various iterations, was implemented throughout Manhattan for all future work. It was a new process, and it was met with backlash. However, after proper training and understanding of the intent, it was widely accepted. Though all future jobs followed this newly developed process, a solution still had to be developed for the lack of productivity in the past and for other boroughs that were lacking productivity.
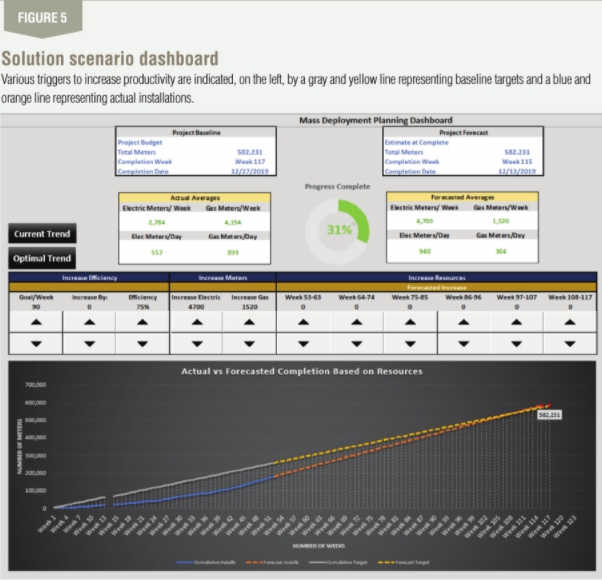
The solution scenario analysis dashboard was a tool used to figure out the proper strategy. The dashboard, as seen in Figure 5, was used to test various triggers that may increase productivity. On the left, the gray and yellow line represents baseline targets and the blue and orange line represents actual installations. Triggers such as in-creasing efficiency, increasing meters and increasing resources were placed with “higher” and “lower” buttons to test out the solution.
After much deliberation, a new technician team was formed to target the old jobs that should have been completed originally. This team was also assigned weekly targets and was going to use the same installation plan as the rest of Manhattan. The only caveat, however, was that building access was not guaranteed. Building supervisors only guaranteed access when the entire building was going to be serviced, as it required a shutdown of electricity; thus, individual units in the building were not a priority.
For this reason, a weekly area was established for teams to work on instead. If technicians were not able to gain access to a building on a Monday, there was a high probability of gaining access on another day in the week.
Another change was rather than working individually, technicians would work in groups, each with an electric and gas technician. This allowed for collaboration while holding one another accountable for weekly targets. Installers were also incentivized for completing more than their weekly targets
Measuring the project benefits
The various solutions implemented throughout this project led to an increase in productivity of more than 100% and achieved the required schedule to avoid penalties. Different boroughs throughout Greater New York all benefited from the strategies that were first tested in Manhattan. Through multiple iterations, time wasted during travel, accessibility and material coordination, planning and logistics was significantly reduced. As mentioned earlier, the primary sources of waste reduction were in wait, extra processing, transportation and motion.
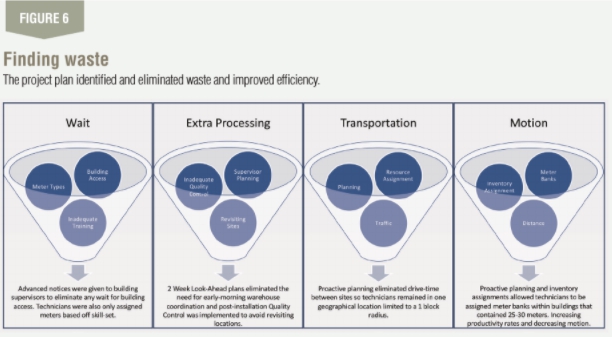
Directly, the process became more proactive rather than re-active through identification and elimination of these wastes. Figure 6 displays the waste contributors and the solutions implemented for improvement.
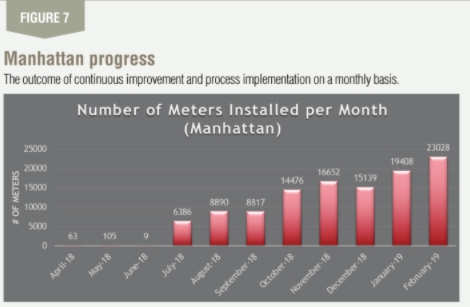
Figure 7 portrays the outcome of continuous improvement and process implementation on a monthly basis. By the end of the contract, the number of meters being installed, per month, rose to 23,000. Through the identification of these wastes and continuously working through eliminating them, the team was able to increase productivity by more than 100% in a short period.
Comments :