
Enhancing Value Stream Mapping for Manufacturing
Enhancing Value Stream Mapping for Manufacturing
ISE Magazine April 2021 Volume: 53 Number: 4
By Shahrukh A. Irani
https://www.iise.org/iemagazine/2021-04/html/irani/irani.html
In Chapter 2 of their 2003 groundbreaking book, Lean Thinking, James P. Womack and Daniel T. Jones, the pioneers of Lean, wrote: “Our initial objective in creating a value stream map identifying every action required to design, order and make a specific product is to sort these actions into three categories: 1. Those which actually create value as perceived by the customer; 2. those which create no value but are currently required by the product development, order filling or production systems (Type One muda) and so cannot be eliminated just yet; and 3. Those actions which do not create value as perceived by the customer (Type Two muda) and so can be eliminated immediately. Once this third set has been removed, the way is clear to go to work on the remaining nonvalue-creating steps through use of (the principles of Lean).”
Value is what the customer gets, like a product or a service of high quality, in a fair period of time at a fair price that he or she is willing to pay.
A value stream is all the steps, both value-added and nonvalue-added, which must be performed in a manufacturing or service process or system to deliver that product or service to a customer.
Value Stream Mapping (VSM) is the (manual) method that produces a map that helps to see and understand the material and information flows involved in a product’s value stream as it makes its way from beginning (raw material) to end (finished product).
A value stream map permits the identification of every process in the flow of a product family, pulls them out from the background clutter of the organization and builds an entire value stream based on the principles of Lean. The map helps to plan and prioritize the changes within a value stream instead of a whack-a-mole “blitzkrieg” of kaizens to eliminate waste randomly throughout the organization, which is what typically happens with other continuous improvement programs like Theory of Constraints and Six Sigma.

The attached list includes the reasons why the developers of VSM, Mike Rother and John Shook (“Learning to See: Value Stream Mapping to Create Value and Eliminate Muda,” 2009), consider the method to be an essential tool to plan the implementation of Lean in any manufacturing or service system. However, the literature suggests that within Toyota, a value stream map is called a material and information flow diagram and value stream mapping is called material and information flow analysis.
How a value stream map helps to implement Lean
 |
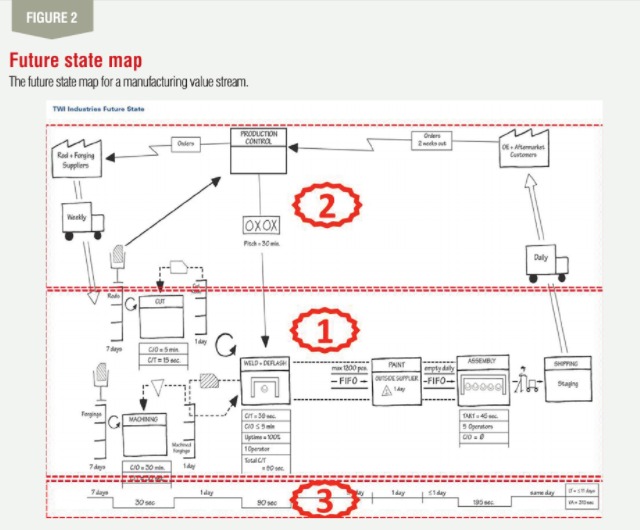 |
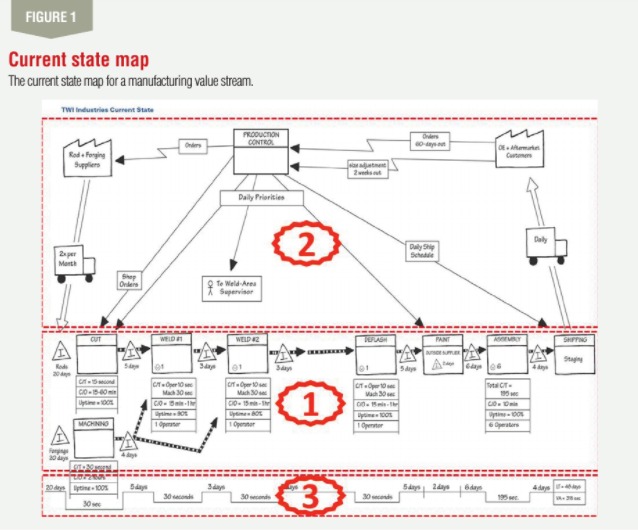
The standard approach to prepare a current state map for a product’s value stream is to follow the product’s production path from customer to supplier and carefully draw a visual representation of every process (step) in the material and information flow(s) for that product. The VSM that results, such as the current state map shown in Figure 1 and the future state map shown in Figure 2, consists of three sections: The material flow which is the section marked as 1 in both figures; the information flow, which is the section marked as 2 in both figures; and a timeline, the section marked as 3.
Next is a standard set of key questions asked about the current state map to develop a future state map, such as the one shown in Figure 2:
- What is the takt time?
- Will you build to a finished goods supermarket or directly to shipping?
- Where can you use continuous flow processing?
- Where do you need to use supermarket pull systems to control production of upstream processes?
- At what single point in the production chain (the pacemaker process) will you schedule production?
- How will you level the production mix at the pacemaker process?
- What increment of work will you consistently release and take away at the pacemaker process?
- What process improvement will be necessary for the value stream to flow as your future state design specifies?
The future state map describes how value should flow in the value stream and displays a portfolio of projects that must be done to improve the value-adding steps in the value stream and eliminate or reduce the nonvalue-adding steps (waste) in the value stream (Rother and Shook, 2009).
The primary goal of this article is to suggest that high-mix low-volume (HMLV) manufacturers should quit using value stream mapping. Instead, they should switch to using maps like the ones shown in Figures 3-7 that help to visualize and analyze multiproduct production systems.
HMLV manufacturers, especially job shops that wish to implement Lean, should stop using value stream mapping to guide their Lean implementation. Any effort to use VSM to implement Lean in an HMLV production system, especially a job shop, will fail because of the numerous limitations of the method ( Job Shop Lean: An Industrial Engineering Approach to Implementing Lean in High-Mix Low-Volume Production Systems, Irani, 2020). Instead, they should invest in a software toolkit that has both the data analysis and visualization capabilities to (heuristically) solve three commonplace and hard problems that all industrial and systems engineers) are familiar with:
Doing a cluster analysis of their entire product mix to identify potential product families in their entire product mix. Each product family is a value stream.
Generating a flow diagram for each product family. Alternatively, this flow diagram could display any large meaningful sample of products extracted from their product mix based on operational or business criteria or their entire product mix.
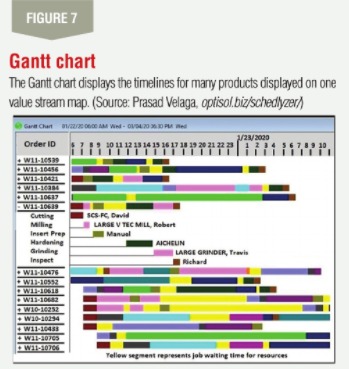
Generating a Gantt chart (Figure 7) that shows the production schedule for each cell and the external work centers (possibly including the vendors) in the facility. Or the Gantt chart could display the production schedule for all production resources in the entire facility.
The following provide the details for some of the major limitations of value stream mapping with a brief description on how to overcome each limitation using well-established ISE science and software.
Limitations of value stream mapping: General
Limitation: VSM is a manual method that is slow, cumber-some and error-prone.
How to eliminate it: Software, such as eVSM, IFAKT and Minitab Companion, is available.
Limitation: VSM does not utilize the science and tools that ISEs (industrial and systems engineers) routinely use in their jobs.
How to eliminate it: A future state can be achieved using practices similar to or even beyond those listed earlier. For example, there is ample opportunity to utilize ISE methods like assembly line balancing, work study, facilities planning, material handling, production planning and control, inventory control, systems simulation, supply chain management, warehouse de-sign, operations research and quality control.
Limitation: A current state map is a single snapshot of the state of a dynamic production system on the day (or during the week) that the map was created.
How to eliminate it: The technique of work sampling could be used to obtain multiple snapshots of a dynamic value stream, especially if it is a dedicated multi-product assembly line, aka, mixed model value stream.
Software for finite capacity scheduling, such as PREACTOR, TACTIC and SCHEDLYZER, is available.
Software for dynamic simulation of systems, such as ANYLOGIC, FLEXSIM and SIMIO, is available.
Limitation: VSM assumes that the underlying production system is an assembly line operating in a make-to-stock mode producing a very limited range of highly similar products.
How to eliminate it: There is ample opportunity to extend VSM to handle make-to-order production systems that are not assembly lines. For example, instead of single-piece flow, an order batch could be split into two or more transfer batches, and instead of heijunka, there could be many different orders and each order could have a due date.
Limitation: A single current state map is just about able to capture all the data associated with just one product. It is infeasible (and impractical) to fit and visually display the data for an entire product family on a pencil-and-paper map.
How to eliminate it: In an ideal scenario, a value stream map should become an electronic dashboard that is produced by the ERP (enterprise resource planning) system.
The ERP system would keep refreshing the dashboard with new data pulled in real time from other systems, such as an MMS (machine monitoring system), an MES (manufacturing execution system) and a QMS (quality management system).
Limitation: VSM cannot handle the (upstream) complexity of visualizing and scheduling the synchronized production and delivery of components and sub-assemblies needed to build the final product.
How to eliminate it: An alternative to VSM is the method of value network mapping (Value Network Mapping: Enhancing Value Stream Mapping to Enable Lean Manufacturing in Job Shop-type Custom Manufacturing Facilities, Irani, 2004).
In a value network map (1) the material flow section of the map would be occupied by an operations process chart and flow diagram, and (2) the information flow section of the map would be occupied by a Gantt chart. (www.leanmanufacturing.japan.com)
Limitations of value stream mapping: Material flow(s)
Limitation: A current state map always shows only one product routing. In practice, the product mix of any HMLV production system could consist of hundreds of different products being produced in a factory that could have anywhere from 10 to 100 different work centers.
How to eliminate it: This limitation can be overcome by selecting a representative sample of products using PQ Analysis, PQ$ Analysis or other sampling approaches.
Software for cluster analysis can be used to find several product families in a large product mix. Each product family could be represented by a separate value network map.
Limitation: A current state map does not show the full extent of the “seven forms of waste,” especially transportation, inventory, operator motion and waiting.
How to eliminate it: This limitation can be overcome by generating a flow diagram, a flow process chart and a from-to chart to complement the current state map.
These traditional ISE tools are better than a value stream map for visualizing and measuring the wastes in the flow represented by each and every arrow that appears in a value stream map, regardless of whether that arrow represents a (hard) material flow or a (soft) information flow.
Limitation: A value stream map focuses on one product family. It fails to show if that family is sharing manufacturing resources with one or more other product families in the product mix.
How to eliminate it: This limitation can be overcome by generating a flow diagram, a flow process chart and a from-to chart to complete the current state map.
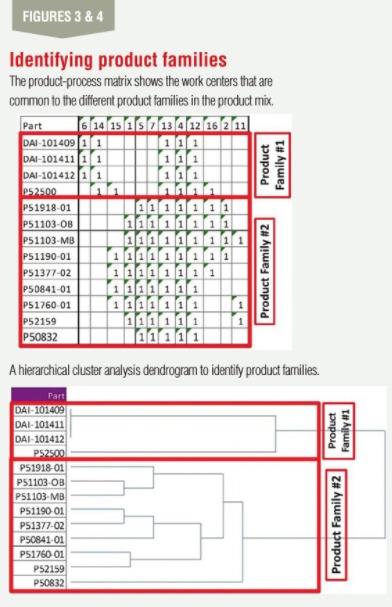
Software, such as PFAST and SGETTI, is available to over-come this limitation. For example, Figure 3 shows the work centers that are common to the different product families in the product mix.
Limitation: A product family is a group of products that pass through (almost) the same processing steps performed on common equipment. In the case of a typical HMLV manufacturer, their product mix could have hundreds if not thousands of different products. For example, Figures 3 and 4 were generated using data obtained from a multiproduct, multimachine printed circuit board fabrication facility. In contrast, VSM does not have any demonstrated capability to analyze a large product mix to identify one or more product families.
How to eliminate it: Cluster analysis would help to approximate the number of clusters and determine the extent of duplication of work centers needed to separate product families with common work centers. Figures 3 and 4 present a visualization of two potential product families, and the corresponding group of work centers that will constitute the cell to produce each product family.
Software like Matlab, Minitab and JMP offer a range of well-established cluster analysis algorithms. Alternatively, software like Python and R can be used to program cluster analysis algorithms from scratch.
Limitation: A value stream map ignores the impact of facility layout, material handling, lot splitting (or lot streaming), and related practices.
How to eliminate it: This limitation can be overcome by generating a flow diagram, a flow process chart and a from-to chart to complement the current state map.
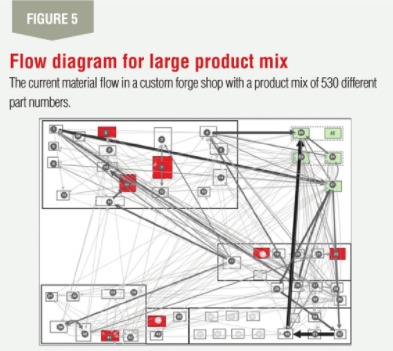
Software, such as PFAST and SGETTI, is available to overcome this limitation. Figure 5 is the flow diagram for the current material flow in a custom forge shop with a product mix of 530 different part numbers. A value stream map developed for a single forging could not have exposed the waste that can be discovered using a flow diagram developed for the entire product mix.
Limitations of value stream mapping: Information flow(s)
Limitation: The process parameters shown in the data box for each process step in any current state map may not be accurate because they are recorded on the day that the map is created.
How to eliminate it: Software for time and motion study, such as OTRS10, TIMER PRO, PROPLANNER and QUETECH, is available to overcome this limitation.
Limitation: The process parameters shown in the data box for each process step in any cur-rent state map are assumed to remain constant.
How to eliminate it: Software for machine monitoring, such as MACHINEMETRICS, FACTORYWIZ and MERLIN, can collect the data over a period of time to update standard times and variability in that data.
Limitation: The future state map is designed for a constant takt time and a very limited product mix.
How to eliminate it: Software for dynamic simulation of systems, such as ANYLOGIC, FLEXSIM and SI-MIO, is available to overcome this limitation.
Software, such as eVSM, IFAKT and Minitab Companion, is available to model production systems like, 1. several variants of the same standard product are produced on the same line; or 2. several products sharing the same platform are produced on the same line.
Limitation: The template of icons for creating a future state map is limited to a pull scheduling system for a make-to-stock production system, specifically an assembly line.
How to eliminate it: There is ample opportunity for creative ISEs to expand the template of icons for creating a future state map to capture other pull scheduling systems (CONWIP, POLCA, DRUM-BUFFER-ROPE), different priority dispatching rules (earliest due date, critical ratio, common setup) and other HMLV production systems (job shop, flow shop, flexible job shop, engineer to order).
Limitations of value stream mapping: Timeline for production lead time
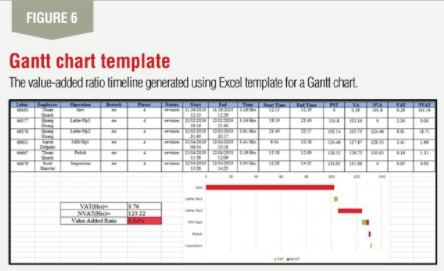
Limitation: At the bottom of every current state map and future state map, a timeline is drawn manually to show the value-added times, nonvalue-added times and production lead time (= VA times + NVA times) for the product (family).
How to eliminate it: The same timeline can be produced using the Excel template for a Gantt chart as shown in Figure 6.
Limitation: The only performance metric that is calculated to assess the order fulfillment capabilities of the production system is the value-added ratio) = (sum of all VA times) ÷ production lead time.
How to eliminate it: The value-added ratio metric should be complemented by the three Theory of Constraints metrics: throughput, inventory and operating expenses.
A multiproduct Gantt chart produced by the ERP system (or a third-party finite capacity scheduler integrated with the ERP system) would help to see the nonvalue-added times in the timeline for each product. The NVA times on the timeline of each work center are due to the competition for shared resources with other products, material handling delays, etc. Figure 7 illustrates how a multiproduct, multimachine Gantt chart can simultaneously display the timelines for many products on a single value stream map.
HMLV manufacturers, especially job shops that wish to implement Lean, should stop using value stream mapping to guide their Lean implementation. Instead, they should use an ISE software toolkit that has the data analysis and visualization capabilities to: 1. do a cluster analysis of their entire product mix; 2. generate a flow diagram for their entire product mix; and 3. display one or more Gantt charts for the production schedule for any planning horizon.
Comments :